Financial Projections
A stabilized, full-schedule operating model for Ballparks National — now reflecting the annual Ozark Cheer Classic and the new Ozark Amphitheater. Adjust the assumptions below and the charts, totals, and sensitivity analysis update live.
Include the Resort Water Park & Lazy River
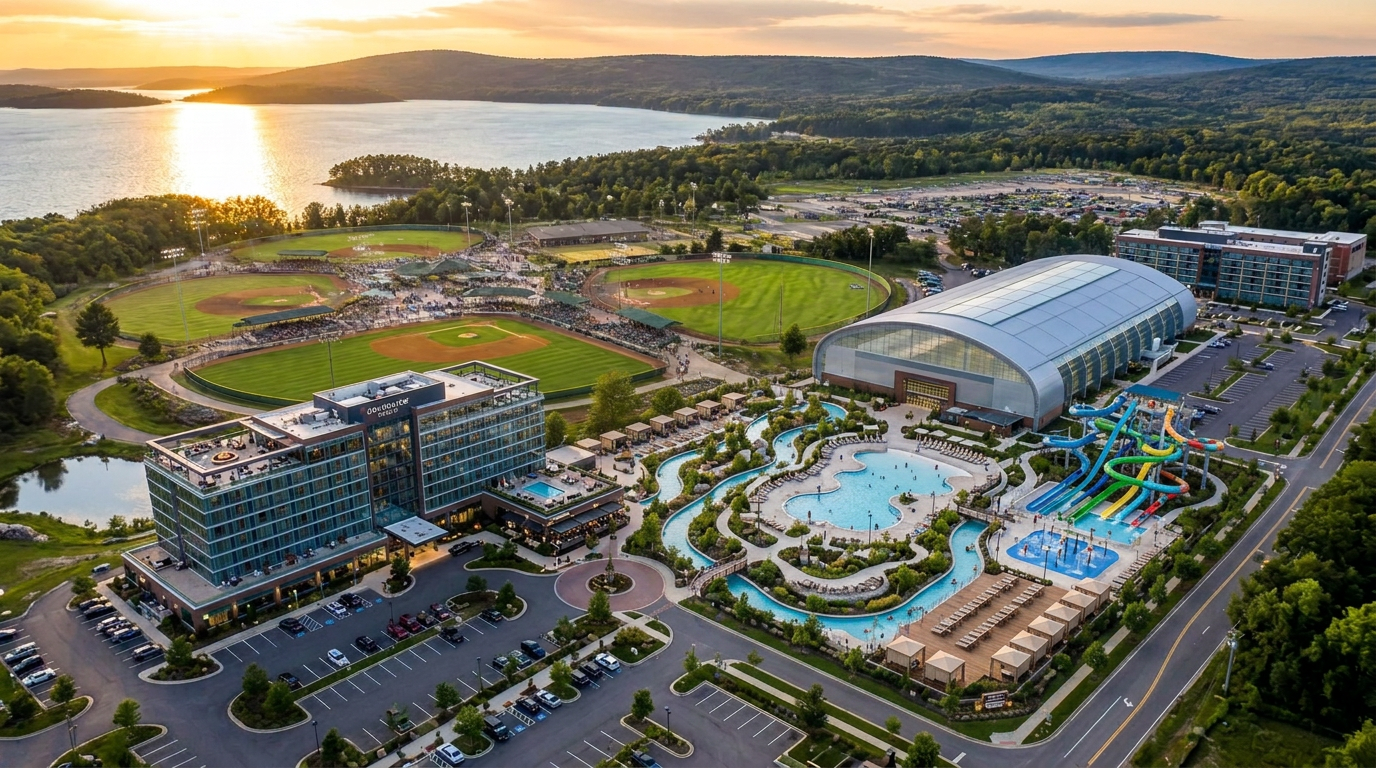
Layer the water park option into the pro forma. It adds $40.0M of development cost and an estimated $10.5M in stabilized annual revenue (~$4.4M added NOI).
$40.15M
$27.04M
$13.12M
32.7% NOI margin
Revenue by Stream
Expense Breakdown
Assumptions Editor
Edit any line below — every chart and total recalculates instantly.
Revenue Streams
Diamond Tournament Entry Fees
Baseball & softball across 8 tournament-grade fields · demand-driven
Outdoor Multi-Sport Tournaments
Soccer, lacrosse, football & field hockey events on the outdoor complex · demand-driven
Phase 2 Indoor Complex Events
Volleyball, basketball & indoor club-sport tournaments and leagues · demand-driven
Gate & Admissions
Spectator passes across all diamond, field & indoor events · demand-driven
Training — The Lab
Performance training, camps & clinics
Merchandise & Pro Shop
Branded apparel, equipment & event gear · demand-driven
Concessions & Food
Food, beverage & catering across all venues · demand-driven
Facility Rentals
Non-event field, court & space rentals
On-Site Lodging
Team & family on-campus housing · demand-driven
Sponsorship & Naming Rights
Title, field & venue partnerships
Parking
Event-day parking · demand-driven
Ozark Cheer Classic & Spirit Events
Annual cheer championship — registration, gate, vendor & spectator · demand-driven
Ozark Amphitheater Events
Concerts, festivals & outdoor events — tickets & rentals · demand-driven
Operating Expenses
Salaries & Staff
Full-time, seasonal & game-day staff across all venues
Field & Facility Maintenance
Grounds, turf, courts & building upkeep
Concessions COGS
Food & beverage cost of goods · demand-driven
Merchandise COGS
Apparel & equipment cost of goods · demand-driven
Utilities
Power, water & HVAC
Marketing & Sales
Recruitment, advertising & digital
Insurance & Risk
Liability, property & event coverage
Officials, Umpires & Refs
Umpires, referees & certified judges across all sports · demand-driven
Event Operations
Setup, security, medical & logistics across all venues · demand-driven
Indoor Complex Operations
Court conversion, staffing & utilities for the Phase 2 indoor complex · demand-driven
Amphitheater Production & Talent
Talent fees, staging, sound & lighting · demand-driven
Cheer Event Operations
Spring floor, scoring, judging panel & awards · demand-driven
Lodging Operations
Housekeeping, supplies & front desk
Technology & Streaming
Live streaming, scoring & ticketing platforms
Administrative & G&A
Office, legal, accounting & overhead
Sensitivity Analysis
Demand-driven (variable) revenue and expense lines flex with attendance and participation, while fixed costs hold. This shows how Net Operating Income responds to a swing in demand.
| Demand Scenario | Revenue | Expenses | NOI | Margin |
|---|---|---|---|---|
| -20% | $33,410,000 | $25,198,000 | $8,212,000 | 24.6% |
| -15% | $35,095,000 | $25,657,250 | $9,437,750 | 26.9% |
| -10% | $36,780,000 | $26,116,500 | $10,663,500 | 29.0% |
| -5% | $38,465,000 | $26,575,750 | $11,889,250 | 30.9% |
| 0% (Base Case) | $40,150,000 | $27,035,000 | $13,115,000 | 32.7% |
| +5% | $41,835,000 | $27,494,250 | $14,340,750 | 34.3% |
| +10% | $43,520,000 | $27,953,500 | $15,566,500 | 35.8% |
| +15% | $45,205,000 | $28,412,750 | $16,792,250 | 37.1% |
| +20% | $46,890,000 | $28,872,000 | $18,018,000 | 38.4% |
Full Branded Report
Download the polished pro forma or the editable financial model.
The full branded report is held in the secure Ballparks National document library. Use the buttons above to download it — you'll be asked to sign in with an admin account if you aren't already.